


Imagine your database is a massive, sprawling library. Without a good system, finding a single book would be a nightmare—a slow, painful process of checking every shelf. Database performance optimization is the art of turning that chaos into a perfectly organized library, complete with a digital catalog, where you can pinpoint any book in a matter of seconds.
It's an ongoing effort to fine-tune how your database stores, retrieves, and handles data, all in the name of speed and efficiency.
Why Database Performance Optimization Matters
Simply put, optimizing your database makes your applications faster and more dependable. A sluggish database means a poor user experience, which shows up as laggy interfaces, spinning wheels, and frustrating timeouts.
When users have to wait, they get annoyed. That annoyance leads to higher bounce rates, bad reviews, and ultimately, lost revenue. The health of your database is directly connected to the health of your business.
But it's not just about speed—it's also about smart resource use. An unoptimized database is a resource hog, eating up way too much CPU, memory, and disk space, which inflates your hosting bills. By tuning your database, you can handle more users and more data on the same hardware. That means you can put off expensive server upgrades and improve your bottom line.
This focus on efficiency isn't unique to tech. For example, learning how to boost earnings with conversion rate optimization strategies follows the same principle: get better results from the resources you already have.
The Core Pillars of Optimization
To get a database running like a well-oiled machine, you need to focus on a few key areas. Think of it as a three-legged stool—if one leg is wobbly, the whole thing is unstable. Mastering all three is the secret to building a high-performance system.
A solid optimization strategy is built on the following interconnected pillars, each tackling a different part of the performance puzzle.
Core Pillars of Database Optimization
| Pillar | Primary Goal | Common Techniques |
|---|---|---|
| Query Optimization | Make data requests as efficient as possible. | Rewriting SQL, simplifying joins, avoiding full table scans. |
| Index Refinement | Create "shortcuts" for faster data retrieval. | Adding missing indexes, removing unused ones, using composite keys. |
| Resource Management | Ensure the database has the hardware it needs. | Upgrading RAM/CPU, configuring storage, load balancing. |
By addressing all three pillars, you create a comprehensive performance strategy that covers every angle, from the code itself to the hardware it runs on.
This infographic gives a great visual breakdown of how these three core pillars work together.
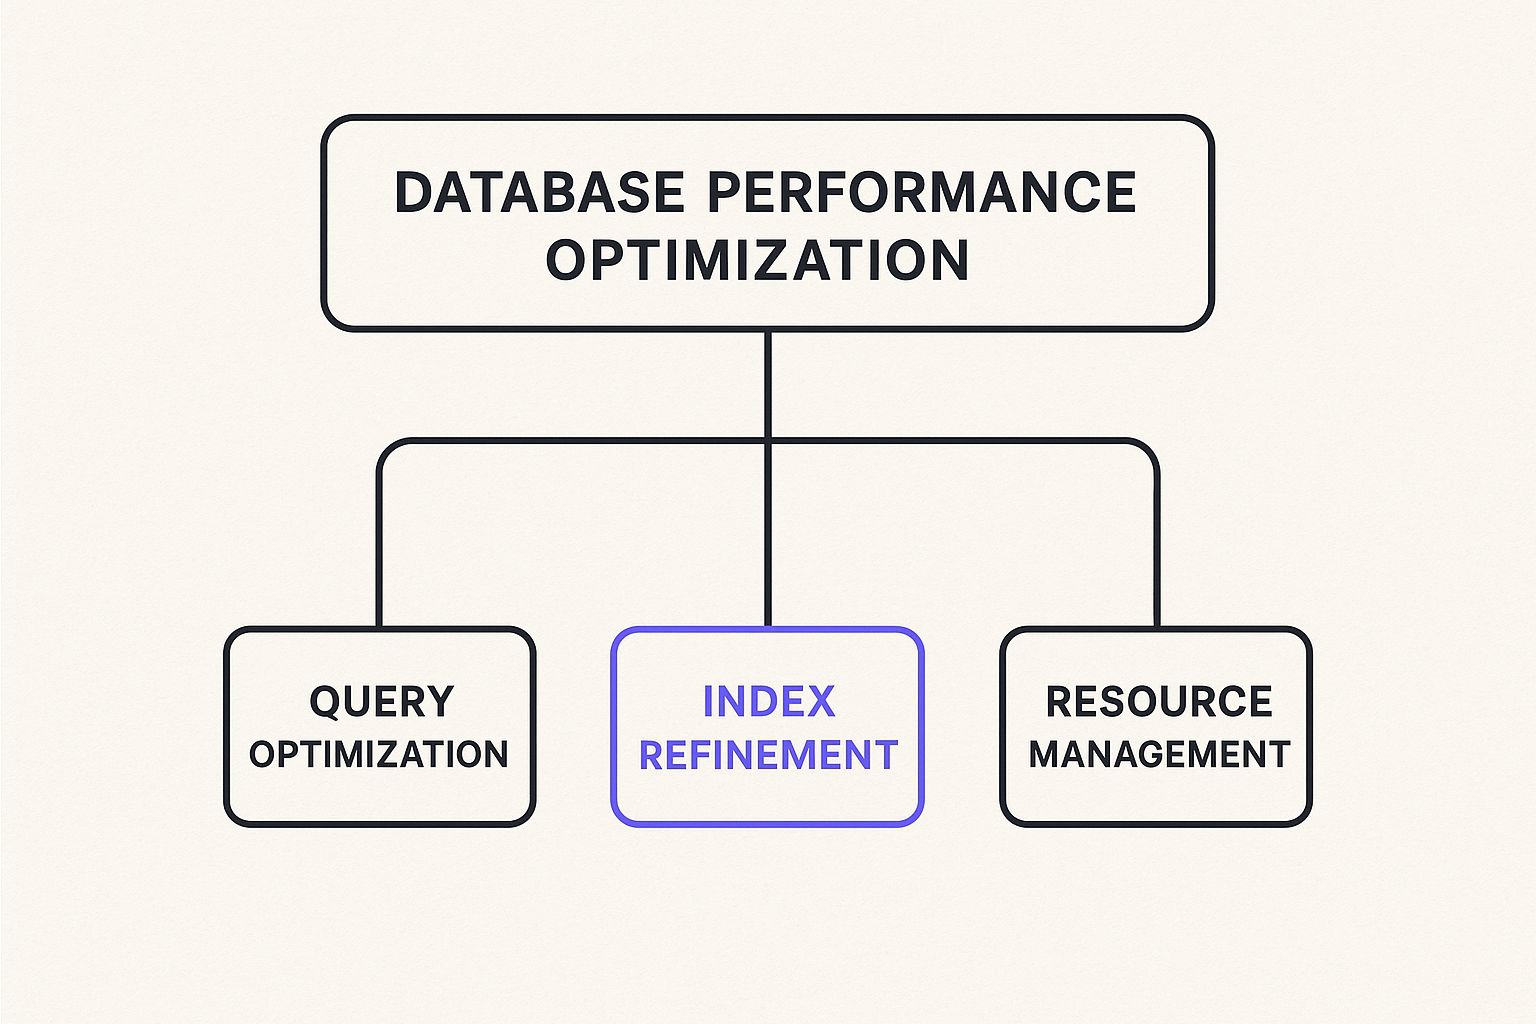
As you can see, true optimization isn't just about tweaking one thing. It's a balanced act that requires looking at how your queries are written, how your data is structured, and how your infrastructure is configured to support it all.
Finding and Fixing Performance Bottlenecks
You can't fix a performance problem until you find it. Proper database optimization isn't about blind guesswork; it's a data-driven diagnostic process. Think of your database like a patient and your monitoring tools as the diagnostic gear—they help you go from a vague symptom like "the app is slow" to a precise diagnosis like "this specific query is causing a disk I/O bottleneck."
This process kicks off with understanding the key metrics that act as your database's vital signs. By learning to read them, you can pinpoint the real sources of slowdowns, whether they're coming from clumsy queries, hardware that can't keep up, or a flawed database design.

Identifying Common Performance Metrics
To get an accurate diagnosis, you need to monitor the right indicators. These metrics are a clear window into how your database is handling its workload, much like a car's dashboard gives you the lowdown on speed, fuel, and engine temp.
Here are the essential metrics to keep an eye on:
- Query Latency: This measures the total time a query takes from start to finish. High latency is usually the most direct symptom of a performance issue, telling you that users are waiting longer than they should.
- Throughput: This metric counts how many queries or transactions are processed per second. A sudden drop here can signal a growing bottleneck that's stopping the system from keeping up with demand.
- CPU and Memory Usage: If your CPU or memory usage is consistently high (often above 80%), your hardware is likely struggling. This could be due to inefficient queries hogging resources or just a sign you need beefier hardware.
- Disk I/O (Input/Output Operations Per Second): This tracks how fast the database can read from and write to storage. Slow disk I/O is a classic bottleneck, especially for apps with heavy read/write activity.
A high cache hit ratio is a fantastic sign of a healthy, well-tuned database. It means the system is smartly using memory to serve data instead of relying on slower, more expensive disk reads.
Watching these metrics over time helps you establish a performance baseline. That baseline is critical because it lets you spot any deviations that signal a problem is brewing—long before it ever impacts your users.
Using Profilers and Monitoring Tools
Once your metrics point you toward a problem, the next step is to grab specialized tools to dig deeper. Query profilers and monitoring dashboards are your best friends for this investigation.
A query profiler breaks down individual SQL statements and gives you an execution plan. This plan is a roadmap that shows exactly how the database engine is getting the data you asked for. It shines a light on inefficient moves like full table scans (reading every single row in a table) or messy joins, which are common culprits behind slow queries.
Dashboards, on the other hand, give you a high-level, real-time view of your database's overall health. They visualize the key metrics we just talked about, helping you connect the dots. For instance, a spike in query latency that happens at the same time as a jump in CPU usage points directly to a resource-hungry query that needs to be optimized. This structured approach, much like what you can learn about content filtering to protect online safety, relies on systematic analysis to get the job done right.
Mastering Query and Index Optimization
When it comes to database performance optimization, this is where the magic happens. Fine-tuning your queries and indexes is where you’ll see the most dramatic speed improvements.
Think of your database’s execution plan like a GPS for your data. When you ask for information, it maps out the fastest route. A sloppy query is like giving it a vague destination—it’ll probably get there, but it will take the slow, scenic route, burning a ton of resources on the way.
Getting good at this means giving the database precise, efficient directions. It’s all about writing SQL that avoids common performance bottlenecks and creating smart shortcuts (indexes) so the database can find what it needs instantly.

Writing High-Performance SQL Queries
The way you write a query has a direct, massive impact on how much work the database does. A tiny change in syntax can be the difference between a query that runs in milliseconds and one that grinds your system to a halt for minutes. The name of the game is minimizing I/O operations and CPU usage by being as specific as you can.
One of the biggest and most common performance killers? The SELECT * command. It forces the database to pull every single column from a table, even if your app only needs two of them. This wastes memory, clogs the network, and often prevents the database from using helpful indexes that could have sped things up.
Here are a few simple techniques to write better queries right away:
- Specify Columns Explicitly: Ditch
SELECT *. Always list the exact columns you need. It reduces the data being moved and helps the database use indexes more efficiently. - Use
WHEREClauses Effectively: Make sure yourWHEREclauses are selective and filter on indexed columns. This lets the database narrow down the search to just a handful of rows instead of scanning the whole table. - Optimize Joins: A badly structured join can create enormous temporary datasets that eat up memory. Always join on indexed columns and pick the right join type (INNER, LEFT, etc.) for what you’re trying to accomplish.
The Critical Role of Database Indexing
If a database table is a book, an index is its table of contents. Instead of flipping through every single page to find what you're looking for (a "full table scan"), you just check the index and go straight to the right page. This ridiculously simple concept is the entire foundation of fast data retrieval.
An index is a special lookup table that the database search engine can use to speed up data retrieval. It's a pointer to data in a table, allowing the database to perform incredibly fast lookups without scanning every row.
Without the right indexes, even basic queries on large tables become painfully slow. The database is forced to read every single row, and the time it takes grows in a straight line as the table gets bigger. A good index can turn that slow, linear search into a near-instant one.
Choosing the Right Indexing Strategy
Now, not all indexes are created equal, and just slapping an index on every column is a terrible idea. While indexes are great for speeding up read operations (SELECT), they actually slow down write operations (INSERT, UPDATE, DELETE) because the index itself has to be updated with every change. The key is to strike the right balance.
Here’s a quick look at the most common types of indexes and where they shine:
- Single-Column Indexes: The bread and butter. Perfect for columns you frequently use in
WHEREclauses or for sorting (ORDER BY). - Composite Indexes: These indexes cover multiple columns. They're a lifesaver for queries that filter on two or more columns at the same time, letting the database find matching rows much faster.
- Covering Indexes: A special (and very fast) type of composite index. It includes all the columns requested in a query. This allows the database to answer the query using only the index, without ever having to touch the main table. It's about as fast as it gets.
Things are also getting smarter. AI and machine learning are starting to show up in database query optimization. Traditional optimizers use models to guess the "cost" of a query, but they can get it wrong with complex requests. New AI-driven systems learn from past query performance and actual runtimes, allowing them to choose better execution plans. Major platforms are already adding these adaptive features, leading to real-world improvements in speed and efficiency. You can learn more about how AI is shaping SQL query optimization on syncfusion.com.
Ultimately, effective database performance optimization comes down to a one-two punch: writing clean, specific queries and backing them up with a smart indexing plan.
Optimizing Your Hardware and Infrastructure
You can write the most elegant, perfectly optimized queries in the world, but they'll still crawl if the hardware underneath can't keep up. It's like dropping a Formula 1 engine into a rusty old station wagon—the power is there, but the chassis just can't handle it.
Effective database performance optimization starts with the physical foundation. It’s all about matching your hardware resources to the specific demands of your database. A mismatch in CPU, RAM, or storage can create a bottleneck that drags your entire system down.

The Roles of CPU RAM and Storage
To build a solid foundation, you first need to understand what each component actually does. Each piece of hardware plays a distinct part in how your database processes and serves up data.
- CPU (Central Processing Unit): This is the brain of your server. The CPU is responsible for executing query instructions, crunching numbers for calculations, and handling complex sorting or data aggregation. A weak CPU will choke on heavy analytical workloads.
- RAM (Random Access Memory): Think of RAM as the database's super-fast, short-term memory. It's where frequently accessed data is cached, along with query plans and other active data. Enough RAM means fewer slow trips to the disk for information.
- Storage (Disk): This is where your data lives permanently. The speed of your storage directly dictates how quickly data can be read or written, making it the most common and painful hardware bottleneck you'll encounter.
To see how these components work together (and where things can go wrong), it's helpful to compare them side-by-side.
Hardware Resource Impact on Database Performance
| Hardware Component | Primary Role in Database | Impact of Bottleneck |
|---|---|---|
| CPU | Executes query logic, sorts data, performs calculations. | Slows down complex queries, high concurrency, and data processing. |
| RAM | Caches frequently accessed data (the "hot" data) and execution plans. | Forces frequent, slow disk reads, increasing query latency dramatically. |
| Storage (Disk) | Provides long-term data persistence and retrieval. | Creates high I/O wait times, slowing down reads and writes for all queries. |
Each component is a link in the chain, but as you can see, a slow disk can have the most widespread and noticeable impact on everyday performance.
Why Storage Speed Is King
While a powerful CPU and ample RAM are vital, it's often the storage speed—measured in IOPS and latency—that makes or breaks database performance.
Think of it this way: if your database needs data that's sitting in RAM, it's like grabbing a tool from your workbench. It’s right there, instantly available. But if the data isn't in RAM, the database has to fetch it from the disk, which is like having to walk down to the basement to find it.
IOPS (Input/Output Operations Per Second) determines how many trips to the basement you can make per second, while latency is how long each trip takes. High IOPS and low latency mean you have a lightning-fast sprint to the basement, minimizing any delay.
For read-heavy applications, the primary goal is to keep as much of the "hot" or frequently accessed data in RAM as possible. Every time the database has to read from a slow disk instead of fast memory, performance suffers.
This is why smart resource allocation is non-negotiable. As a rule of thumb, many database administrators reserve 60-80% of the server's total RAM just for the database process. This maximizes the cache, keeping disk access to an absolute minimum. You can dive deeper into these performance metrics in modern monitoring frameworks to see how they all connect.
The Power of Connection Pooling
Beyond the core hardware, you also have to consider how your application actually talks to the database. Each time an application needs to run a query, it has to open a connection, which is a surprisingly slow and resource-intensive process involving network handshakes and authentication.
If every single user request has to build a new connection from scratch, your server will waste a massive amount of time and energy just opening and closing doors. That's where connection pooling saves the day.
A connection pool is basically a "carpool lane" for your database connections. It maintains a ready-to-go set of open connections. When your application needs one, it just borrows it from the pool, uses it, and returns it when it's done. It's incredibly efficient and slashes the overhead that comes with managing connections.
By getting your hardware right and using smart strategies like connection pooling, you transform your infrastructure from a potential liability into a true performance asset.
Advanced Strategies for Scale and Reliability
When your app suddenly takes off and your user base explodes, the usual optimization tricks just won't cut it anymore. At this point, **database performance optimization** becomes less about tweaking a single query and more about architecting an entire system that can handle insane traffic and never go down.This is where you need to bring in the heavy hitters: advanced strategies designed for massive scale and bulletproof availability. We're talking about core concepts like replication, sharding, and load balancing—the essential building blocks for a truly resilient data infrastructure that can grow right alongside your business.
Building Resilience with Replication
Database replication is all about creating and maintaining multiple copies of your database. Think of it like making perfect photocopies of a critical document and stashing them in different safe locations. If the original gets torched, you’ve got backups ready to roll.
In the database world, the original is called the master (or primary), and the copies are called replicas. This setup gives you two massive wins:
- High Availability: If the master database crashes—whether from a hardware failure or network glitch—the system can automatically switch over to a replica. This means your app stays online with minimal disruption, keeping your users happy.
- Read Scaling: Let's be real, most apps have way more people viewing content than creating it. By sending all the "read" traffic (like browsing profiles) to the replicas, you let the master database focus only on handling the "writes." This is a game-changer for improving performance in read-heavy applications.
Of course, protecting these replicas is just as vital as securing the master database. You can learn more about keeping your data safe in our guide on how to avoid online scams and protect your data.
Scaling Horizontally with Sharding
Replication is fantastic for handling tons of reads, but what happens when your write traffic gets so heavy that a single master server can't keep up? That's when you turn to sharding. Sharding is a way of scaling horizontally by breaking up one giant database into smaller, more manageable chunks called shards.
Imagine trying to use a single, massive encyclopedia that contained every piece of information in the world. It would be ridiculously slow. Sharding is like splitting that encyclopedia into individual volumes (A-C, D-F, and so on). If you need to look up "Database," you just go straight to the D-F volume, completely ignoring the others.
Each shard is its own independent database holding a unique slice of the total data. By spreading the data across multiple servers, you also spread out the write operations, allowing the system to handle a much, much higher workload.
Sharding allows a database to scale almost infinitely by distributing both data and workload across a cluster of servers. The trade-off? It adds complexity, especially when you need to query data that lives on different shards.
Fine-Tuning for Maximum Throughput
Beyond big architectural moves, there are practical tweaks that can squeeze even more performance out of a scaled-up system. A critical one is tuning your transaction batch sizes, especially in a replication setup. The goal is to maximize throughput—how many transactions you can process per second—without choking the system.
Recent analysis has found that for systems like SQL Server and MySQL, batch sizes between 200 to 500 transactions often hit the sweet spot. Using these moderate batch sizes can seriously boost throughput without causing memory overload or high latency. You can dig deeper into these trade-offs by checking out insights on database replication speed on integrate.io.
It all comes down to this: tuning for your specific workload is key. By combining big-picture strategies like replication and sharding with smart, tactical adjustments, you can build a database that's not just fast, but incredibly scalable and reliable.
Choosing Your Database Monitoring Toolkit
You can't fix what you can't see. When it comes to database performance optimization, a solid monitoring toolkit is your best friend—it’s the eyes and ears of your entire system. Without it, you're just guessing. With it, you can stop reacting to fires and start preventing them altogether.
The world of monitoring tools is massive, but it really boils down to three main flavors. Each one strikes a different balance between cost, complexity, and power, so the best choice really depends on your specific needs and what your tech stack looks like.
Types of Monitoring Tools
Picking the right tool means knowing your options. From the simple stuff that comes out-of-the-box to powerhouse platforms, each has a role to play in keeping your database humming along smoothly.
Built-in Utilities: Most databases already have their own performance monitoring tools baked right in. Think SQL Server's Query Store or
pg_stat_statementsin PostgreSQL. These are awesome starting points because they're free, already integrated, and give you a direct line of sight into query performance and resource drain.Open-Source Solutions: Tools like Prometheus and Grafana have become the gold standard for a reason. They're killer at collecting performance data over time, creating slick real-time dashboards, and setting up smart alerts. They do take a bit more effort to get going, but for teams wanting total control, their power is unbeatable.
Commercial Platforms: If you want an all-in-one, plug-and-play solution, platforms like Dynatrace or Datadog are the way to go. They pack in advanced features like AI-driven root cause analysis and automatic anomaly detection. You're paying for convenience and some seriously powerful features that work right away.
At the end of the day, any good monitoring tool has one job: show you exactly how your database is handling queries. Getting access to query execution plans is a must-have, as it gives you a roadmap of what the database is doing under the hood, instantly showing you where the bottlenecks are.
This screenshot from Prometheus gives you a feel for a typical dashboard monitoring system metrics in real-time.
Visuals like this are a game-changer for tracking trends over time and catching performance dips the second they happen.
Key Features to Look For
No matter which path you choose, any worthwhile monitoring tool needs to have a few core features. When you're weighing your options, make sure you prioritize tools that deliver on these fronts:
- Real-Time Dashboards: You absolutely need to see metrics like CPU usage, query latency, and throughput as they happen. It's the only way to catch problems in the act.
- Historical Trend Analysis: Performance issues don't always happen overnight; sometimes they creep in slowly. Your tool has to let you rewind the clock to spot patterns and diagnose that gradual slowdown.
- Intelligent Alerting: A system that pings you about a potential issue before users start complaining is worth its weight in gold. Look for customizable alerts that can plug into Slack, email, or whatever your team uses.
- Data Security and Privacy: Remember, these tools are handling sensitive performance data. Make sure your toolkit lines up with strong data protection practices. For a deeper dive, check out our guide on how to protect privacy online with essential tips and tricks.
Frequently Asked Questions
Even after you've got the basics down, you'll still run into questions when you start putting database performance optimization into practice. This section tackles some of the most common ones with straight, simple answers to help you keep things running smoothly.
How Often Should I Perform Database Tuning?
Database tuning isn’t a set-it-and-forget-it job; it's an ongoing effort. But how often you need to do it really boils down to your application's workload and where it is in its lifecycle.
Think of it as a regular check-up schedule.
- During Development: Performance checks should be a non-negotiable part of every major feature release. This is your first chance to catch new, potentially slow queries before they ever hit production.
- Post-Launch: Keep an eye on your key metrics daily, but schedule a deeper dive every quarter. This helps you catch performance issues that creep in slowly as your data grows.
- After Major Changes: You need to re-evaluate performance immediately after a big traffic spike, a large data migration, or any infrastructure changes. These events can totally change how your database behaves.
Honestly, the best approach is just proactive monitoring. If you set up the right alerts, your system will literally tell you when it needs help. That way, you're not just guessing with scheduled tune-ups; you're making changes based on real data.
What Are the Most Common Beginner Mistakes?
Anyone new to database optimization tends to stumble into the same few traps. Steer clear of these, and you'll save yourself a ton of headaches and avoid making things even slower.
One of the biggest blunders is over-indexing—slapping an index on every single column "just in case." Indexes are great for speeding up reads, but they add overhead to every write operation (INSERT, UPDATE, DELETE). The trick is to be surgical and add indexes only where your actual queries need them.
Another classic mistake is ignoring the query execution plan. This is basically the database's road map, showing you the exact path it takes to get your data. Not looking at it is like trying to fix a traffic jam without looking at a map—you're just making blind guesses.
How Do I Balance Performance with Cost?
Trying to squeeze more performance out of your database can feel like you're just throwing money at expensive hardware. The real goal isn't to build the fastest system money can buy, but to get the right performance for your budget.
Your best bet is to start with software-level fixes, since they almost always give you the biggest bang for your buck.
- Focus on Query Tuning First: A well-written query can slash resource use by over 90%. That alone can put off the need for a pricey server upgrade for a long, long time.
- Get Smart with Caching: Using memory to store frequently used data is way cheaper than buying faster storage drives.
- Scale Up Smartly: Before you shell out for a big upgrade, figure out where your bottleneck actually is. If your database is waiting on the disk (I/O-bound), a faster CPU is a waste of money. Make targeted hardware improvements only when you have the data to back it up.
By focusing on making your code and queries more efficient first, you make sure that every dollar you spend on hardware delivers a real impact.